Documentation
VT Planner Analysis Controls and Results Guide
Learn how to read VT Planner demand assumptions, simulation controls, calculation settings, variability, and result metrics together.
The Analysis tab combines scenario definition, operating assumptions, and launch readiness. The result report then shows whether the selected assumptions created a stable passenger service outcome.
Use this page as a bridge between entering inputs and interpreting the report.
Demand Used
Demand used is the first control to read before launch. It shows:
- total demand in
% population / 5 min; - incoming demand;
- outgoing demand;
- interfloor demand;
- the source of the resolved profile.
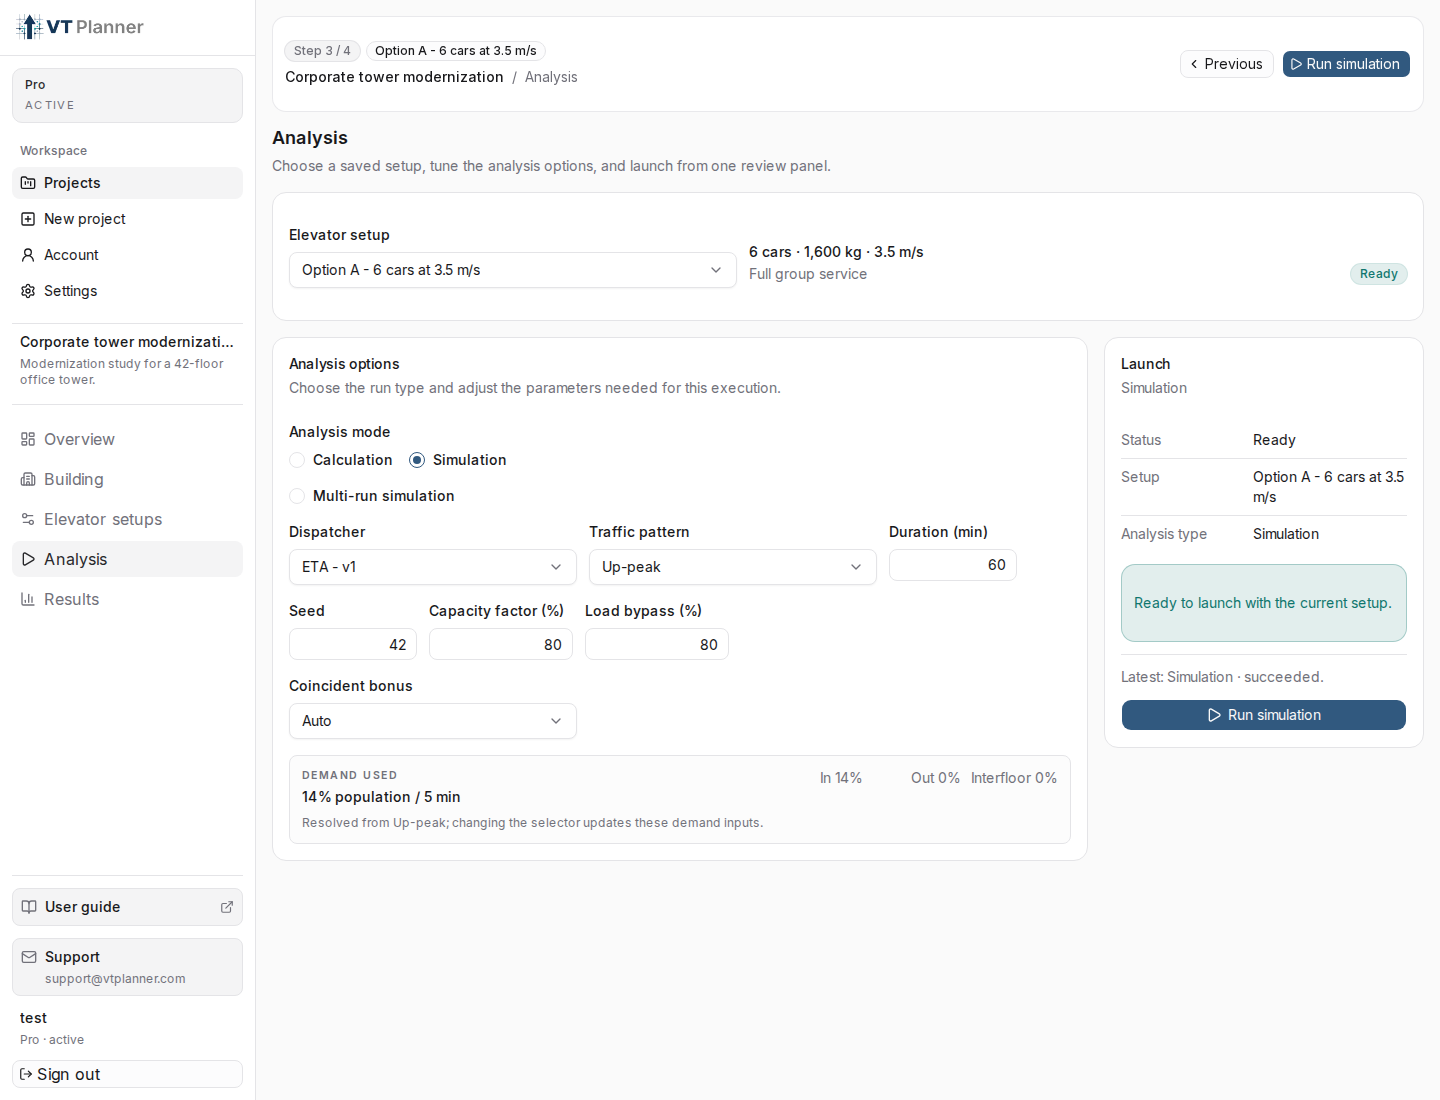
Demand used as the last pre-launch check for the scenario's demand assumptions.If the demand split is not what you expected, review these inputs before launching:
Building type;Calculation method;Traffic pattern;Customdemand fields;General analysisshares;- entrance floors and
Bias.
Simulation Operating Controls
Simulation mode includes controls that affect passenger handling and car behavior.
| Control | What it does | How to use it |
|---|---|---|
Dispatcher |
Selects the car assignment strategy. | Keep the same dispatcher when comparing elevator setups unless dispatcher behavior is the study variable. |
Duration (min) |
Sets the simulated time window. | Use enough time to observe whether queues stabilize or grow. |
Seed |
Makes stochastic passenger generation reproducible. | Use the same seed for direct A/B comparisons, then use multi-run simulation for robustness. |
Capacity factor (%) |
Sets the effective boarding limit as a percentage of rated capacity. | Lower values model less aggressive loading or comfort limits. |
Load bypass (%) |
Defines the load level above which a car may bypass new hall calls. | Use it to model cars that avoid taking additional passengers when already heavily loaded. |
Coincident bonus |
Adjustment for compatible ETA dispatch behavior. | Leave on Auto unless you are deliberately testing a manual dispatcher assumption. |
Calculation Controls
Calculation is useful for fast sizing and structured comparisons. It is not a full passenger process simulation.
Main controls:
Calculation method: chooseUp-peak,Down-peak, orGeneral analysis.Losses (%): applies a margin to calculation timing.Incoming share,Outgoing share,Interfloor share: appear inGeneral analysisand must sum to1.0.
Simple Analytical Methods
Use Up-peak or Down-peak when the study is a normal group sizing check with one default lobby entrance and one dominant traffic direction. These methods keep the model intentionally narrow so RTT, Interval, and Handling capacity are easy to read and compare between elevator setups.
General Analysis
Use General analysis when the analytical study needs more than one flow component or entrance assumption. It supports:
- incoming, outgoing, and interfloor shares in one analytical run;
- multiple entrance floors and relative entrance weights;
- basement entrance demand;
- simple service zoning without transfer floors.
General analysis is still an analytical calculation. It does not create passengers over time, does not accept configured transfer floors, does not model transfer-floor requeueing, and does not show seed variability. For those questions, use Simulation or Multi-run simulation.
Use calculation when you need a quick capacity and interval check. Use simulation when the study depends on stochastic queues, dispatch behavior, zoning transfers, load bypass, or passenger distribution over time.
This distinction is especially important for destination dispatch and transfer zoning. In those cases, interval and handling capacity are useful context, but waiting time, time-to-destination, journey time, completion rate, and queue behavior usually describe the passenger outcome more directly.
Single Simulation Versus Multi-run
A single simulation is a reproducible scenario when the same Seed is used. It is useful for debugging and for comparing obvious differences.
Multi-run simulation repeats simulations to reduce seed dependence. Use it when:
- two setups are close;
- the result depends on high percentiles;
- queues are near saturation;
- a single seed looks unusually good or unusually bad.
In adaptive mode, review convergence before relying on small differences. If the estimate has not converged, treat the comparison as provisional.
Reading Simulation Results
Simulation results should be read as a group:
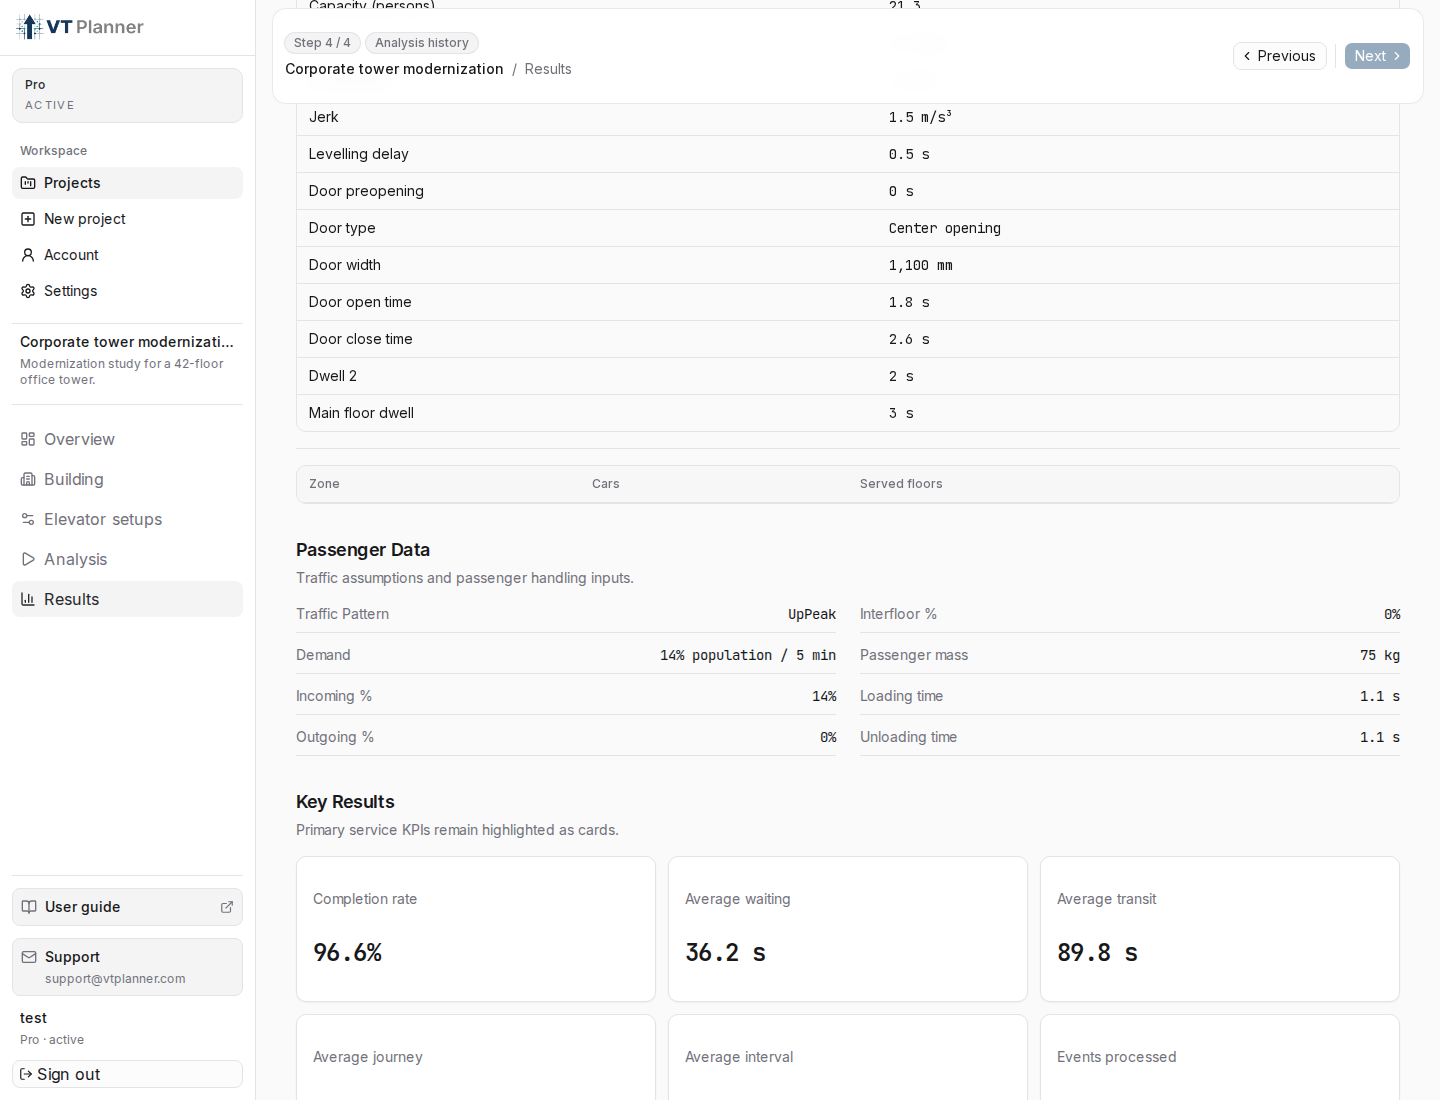
| Metric | What to check |
|---|---|
Completion rate |
Whether generated passengers completed trips during the simulated window. |
Average interval |
Observed service spacing. Useful, but not a complete service quality measure. |
Average waiting |
Average queue time before boarding across completed passenger legs. |
Average transit |
Average in-car travel component. |
Average journey |
Total passenger experience from initial arrival to final alighting. |
P90, P95, P99 |
Tail behavior. Use these to detect bad passenger outcomes hidden by averages. |
Window averages |
Compare full-window values against trimmed-window values when available. |
Reading Calculation Results
Calculation results focus on:
RTT;Interval;Handling capacity;- average passenger time estimates;
- occupancy and capacity factors;
- criteria or informational notes.
Use RTT to understand the cycle mechanics and use Interval and Handling capacity as sizing indicators. Then compare against passenger time estimates and the assumptions used to generate the result.
Comparing Runs
For a clean comparison:
- Use the same saved building version.
- Use clear setup names and notes.
- Confirm the same demand profile in
Demand used. - Keep dispatcher and operating controls fixed unless they are the variable.
- Use the same seed for direct single-run comparison.
- Use
Multi-run simulationwhen conclusions depend on small differences. - Read report scenario data before reading the headline metric.