Documentation
VT Planner Results Guide
Guide to reviewing VT Planner run history, frozen scenarios, metrics, charts, replay, audit data, batches, partial results, and PDF exports.
Results contains the project run history and the detailed evidence for the selected run.
Run History
The table shows:
Type: Calculation, Simulation, Multi-run, or batch;Setup: the saved alternative used;Scenario: profile, method, dispatcher, duration, or other identifying context;Status;Summary;Created.
Select a row to open the full details.
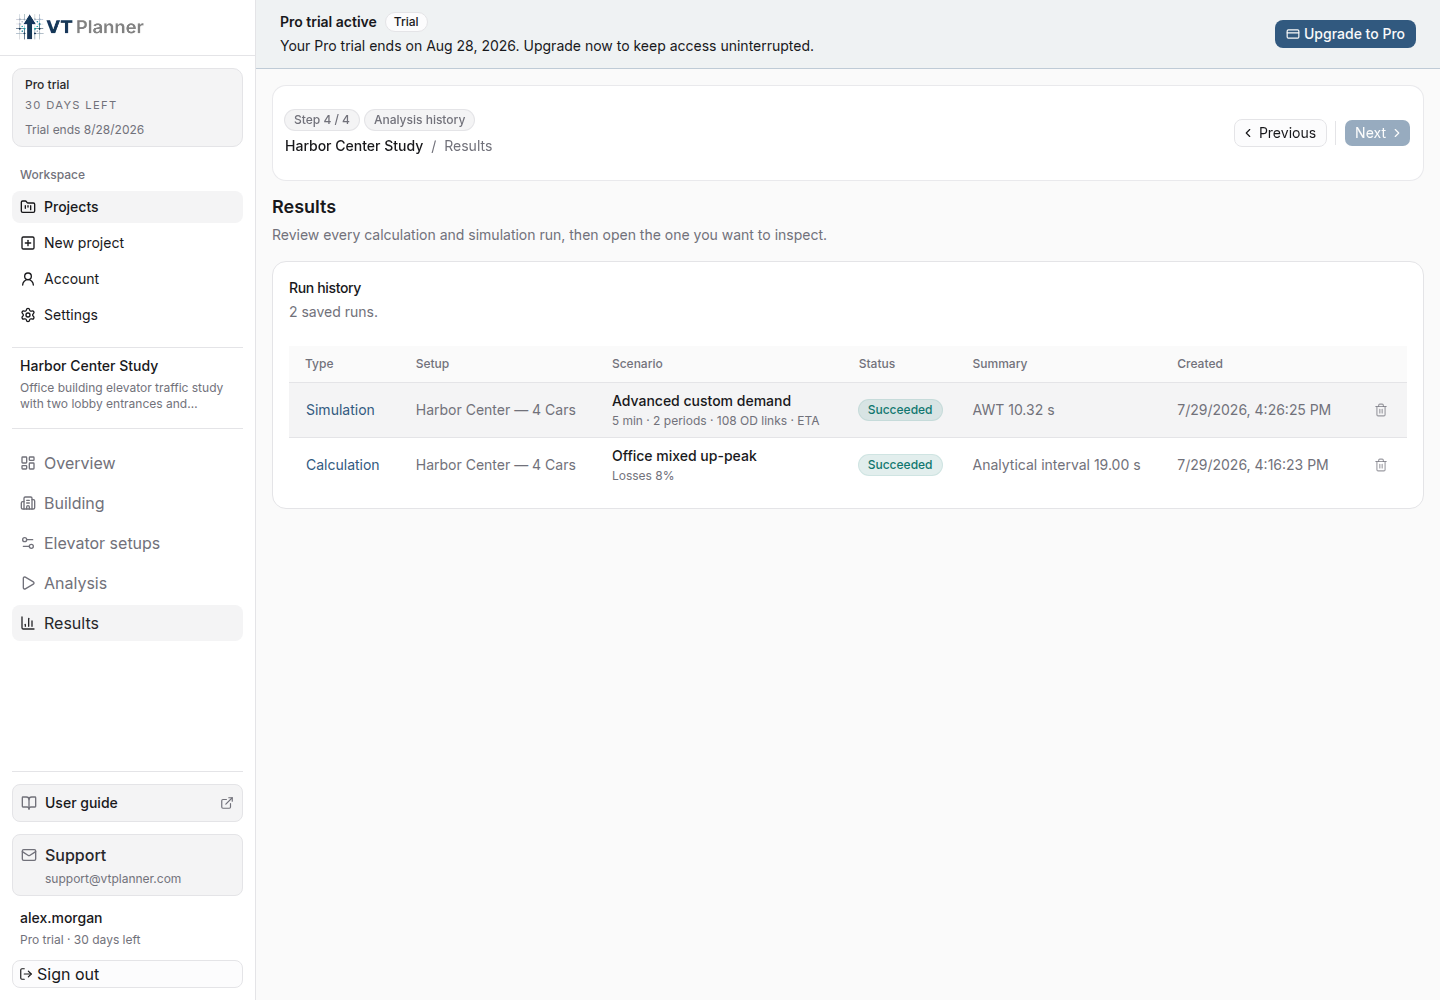
Run Statuses
| Status | Meaning |
|---|---|
Queued |
Waiting to start. |
Running |
The run is being processed. |
Succeeded |
The requested analysis completed with a result. |
Partial |
The run produced a usable result but stopped before the requested horizon. |
Failed |
The run ended without a usable result; open the details to read the failure message. |
Cancelled |
Execution was stopped. A report is available only if a valid partial result was produced. |
Frozen Scenario
Every saved run preserves its building, elevator setup, analysis options, and run configuration. Completed and partial runs also preserve their result; a failed or cancelled run may have no usable result. Later project edits do not rewrite that history.
Before comparing metrics, verify:
- building version, entrances, bias, and population;
- setup name, car data, timings, and service zones;
- Standard profile or Advanced demand schedule;
- dispatcher, duration, seed or multi-run policy;
- capacity factor and load bypass;
- requested and effective duration.
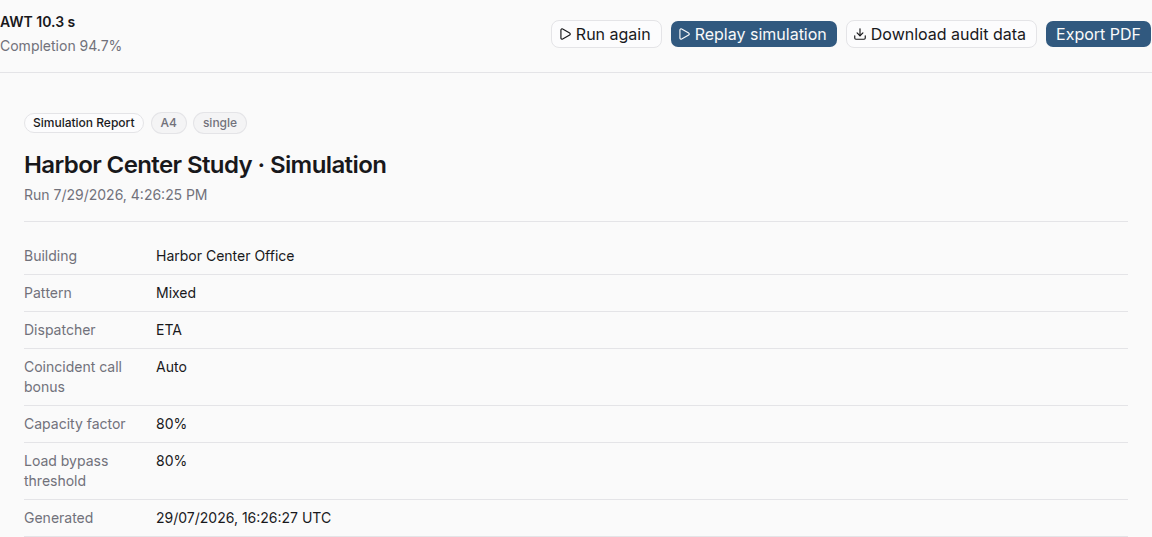
Result Actions
Depending on the run and its status, the detail view provides:
Run again: starts a new run from the saved scenario snapshot rather than substituting current project inputs;Replay simulationorReplay sample: regenerates a replay trace from the frozen simulation scenario when it is compatible;Download audit data: downloads a ZIP of CSV files for independent review;Export PDF: creates a shareable report;Delete run: permanently removes a completed, partial, failed, or cancelled run from project history.
Run again creates a new history entry. The original remains unchanged.
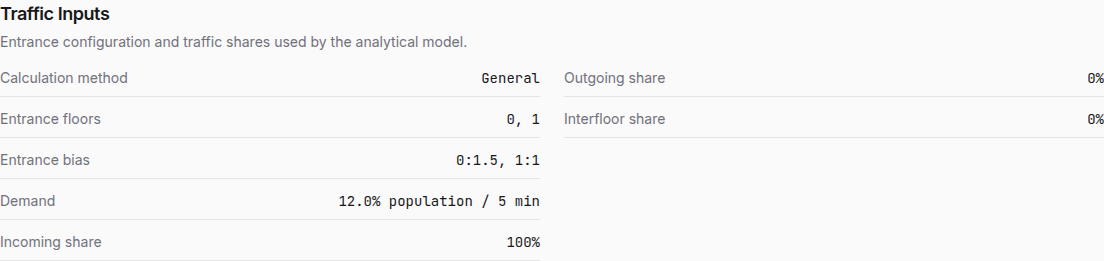
Calculation Results
Calculation reports emphasize:
RTT: representative car round-trip time;Analytical interval: calculated group service interval;Handling capacity: passengers moved in the reference window, also expressed as a percentage of population;- passenger-time estimates;
- occupancy and capacity factors;
- criteria and informational notes.
Use Calculation for sizing and screening. Confirm the traffic profile and losses before comparing alternatives.
Simulation Results
Simulation reports combine headline metrics with distributions and operational evidence:
Completion rate,Average Waiting Time,Time to Board,Transit, andJourneymeasures;- percentile and histogram views;
- passenger activity by direction and time window;
- queue behavior;
- transfer activity when applicable;
- car loads, stops, and spatial movement;
- main-terminal departure headway when the scenario is comparable.
In result labels, AWT means average waiting time, Dist means distribution, and Pctl means percentile.
Use the chart selector to show one chart at a time, and expand a chart when detailed inspection is needed.
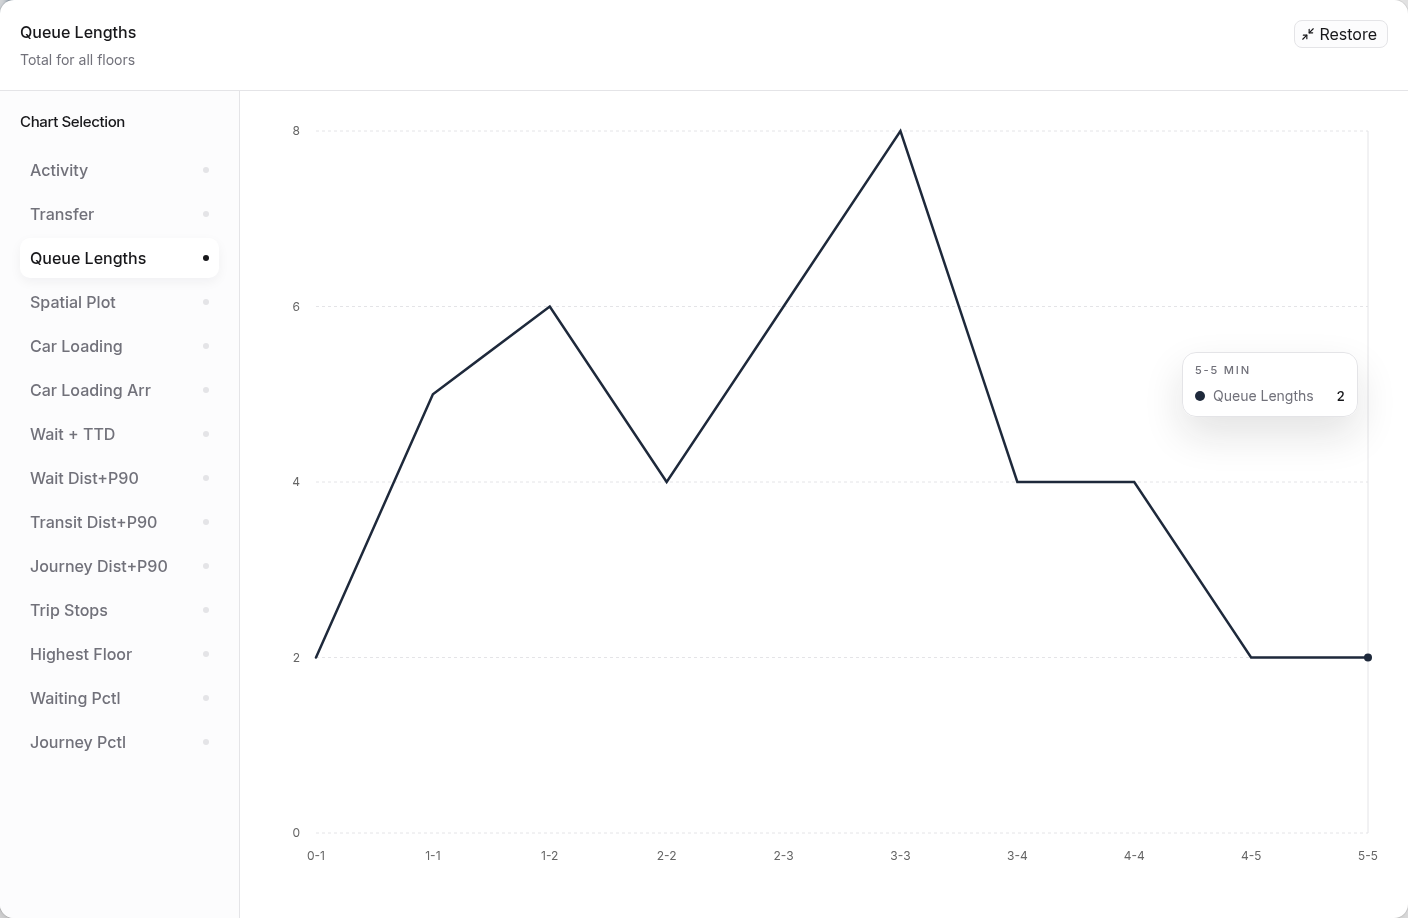
Passenger activity is grouped into five-minute windows; a shorter final window keeps its actual duration. In multi-run results, activity values are means across valid runs.
Treat main-terminal departure headway as an operational diagnostic, not a standalone quality-of-service score. Waiting, time to board, journey time, completion, and queues remain the primary passenger evidence, especially with destination dispatch or multiple entrances.
Multi-run Results
Multi-run reports include:
- valid, failed, cancelled, and aggregated run counts;
- mean metrics across valid runs;
- pooled passenger distributions;
- confidence intervals across valid aggregated runs;
- per-run results;
- a replay sample from one valid run.
The replay sample is one valid simulation, not an animation of the average run.
Batch Results
A Compare variants result includes the common building and scenario, the sweep definition, and a ranked row for every generated alternative.
- Calculation batches rank lower analytical interval first, then higher handling capacity.
- Simulation batches rank lower waiting first; they then use main-terminal departure headway when that metric is comparable, otherwise journey time, followed by higher completion.
Ranking is a reading aid, not an automatic design decision. Confirm car count, capacity, speed, demand, serviceability, and every relevant metric before selecting an alternative. Use Export PDF to retain the complete batch table.
Replay
Replay regenerates a trace from the frozen scenario and helps explain a result spatially. Use:
- play and pause;
- previous and next event;
- the timeline;
- speed controls
1x,2x,5x,10x, and20x.
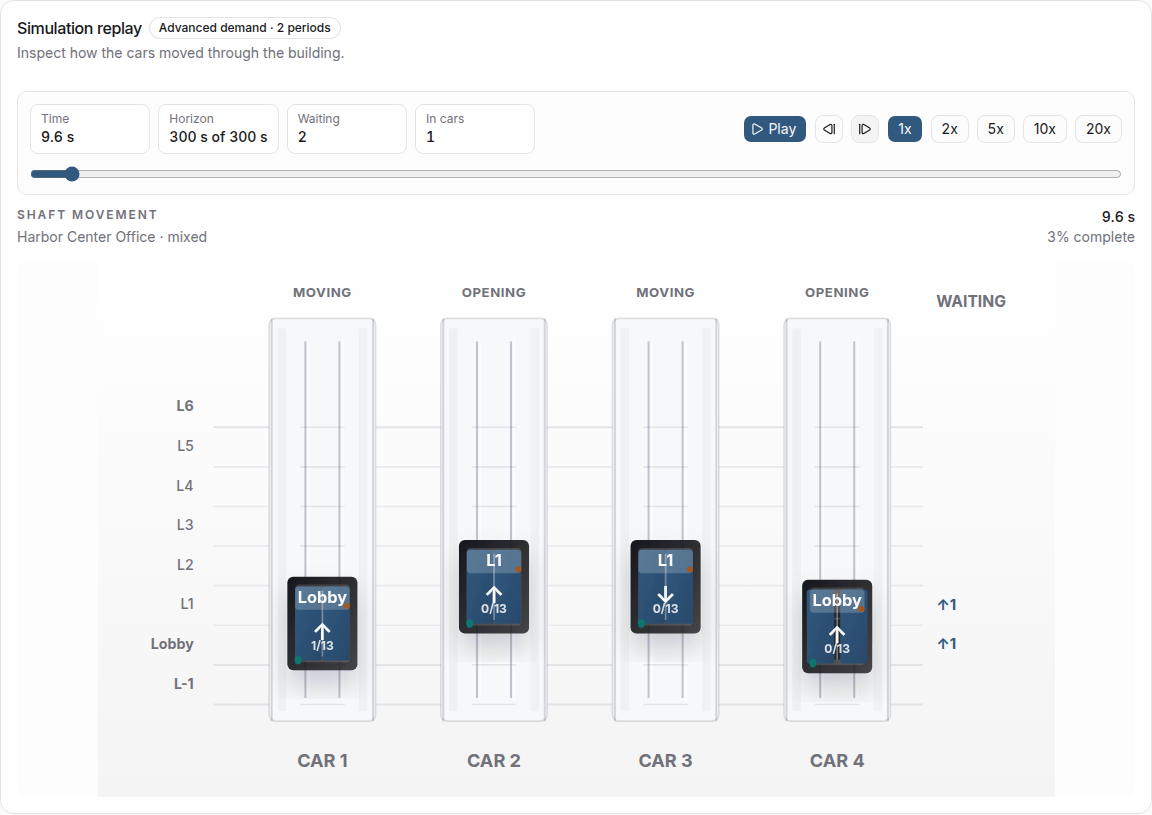
Inspect replay when a chart suggests a persistent queue, a transfer problem, unusual stop patterns, or load-related bypassing. Replay explains the selected trace; use report metrics for the aggregate conclusion.
Replay is available only for compatible Simulation and Multi-run simulation results and supports up to 65 upper floors and 12 elevators. For a larger scenario or an incompatible historical run, use the report, charts, and audit data.
Partial Results
A Partial simulation result shows:
- requested duration;
- effective simulated duration;
- the reason execution ended early.
Interpret its metrics only for the completed horizon. Do not treat it as equivalent to a full-duration result. Correct the cause and run again when the decision requires the full window.
Export and Retention
Use PDF for a readable report and audit data for tabular evidence. Review the generated files before sharing them outside the study.
Deleting a run permanently removes it from project history. Export any required report or audit data before confirming because the action cannot be undone.
Use Analysis Controls and Interpretation for a comparison checklist and the Technical Glossary for metric definitions.